Logistics
Bad inventory forecasts cost money fast. They lead to stockouts, extra inventory, rush shipments that can cost 3x to 5x more, and carrying costs that often run 20% to 30% of inventory value per year.
If I boil this down, the point is simple: forecasting gets better when I stop planning from old, incomplete data and start using live 3PL data. That means using warehouse activity, freight timing, returns, and location-level demand to set better reorder points, safety stock, and replenishment timing.
Here’s the short version:
A 3PL helps by feeding in live data on receipts, picks, backorders, in-transit freight, and returns. That gives me a better read on what to buy, where to place it, and when to move it. It also helps me plan LTL vs. FTL, labor needs, and return-to-stock inventory with fewer last-minute moves.
For manufacturers, retailers, and eCommerce brands, the payoff is clear: fewer stockouts, less excess stock, and better inventory decisions across each DC. That’s the core idea behind this article.
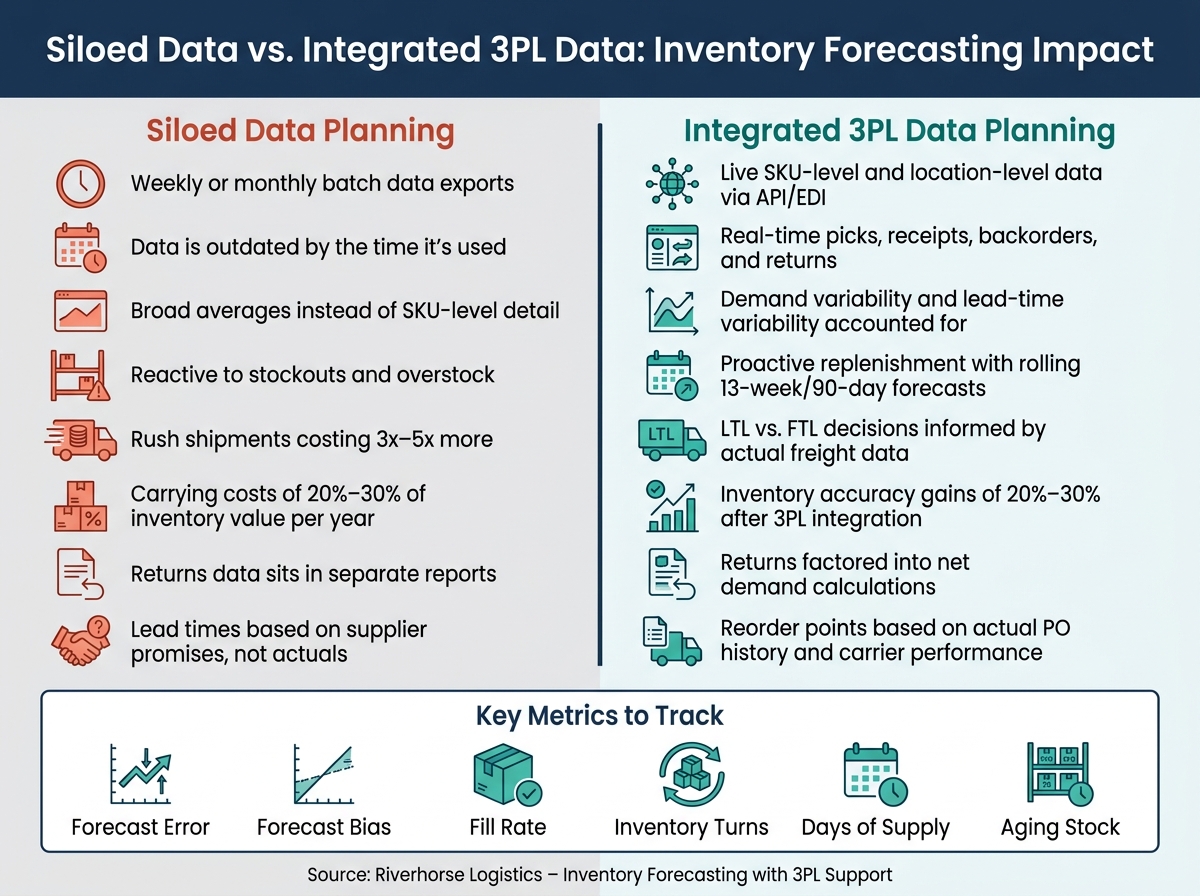
Siloed Data vs. Integrated 3PL Data: Inventory Forecasting Impact
A 3PL brings in day-to-day operating data that in-house planning teams often don’t get on their own. That extra visibility can improve forecast accuracy because planners aren’t stuck waiting for old reports. They can react to live warehouse and transportation signals as demand shifts. And when demand moves fast, that matters. It helps teams spot change before inventory gets out of sync.
That visibility usually starts in the warehouse.
A 3PL can send planners live SKU-level data on receipts, picks, replenishment moves, backorders, and returns through API or EDI. In plain English, routine warehouse activity becomes near-real-time input for planning.
This is especially useful for fast-moving items and SKUs with high return rates. Say returns for one SKU jump right after a promotion. That signal can show up fast in the 3PL’s WMS data. A planner can then adjust the replenishment order before excess stock piles up. Without that link, the same problem might stay hidden for weeks. The payoff is simple: teams can correct course faster when demand, returns, or replenishment patterns shift.
That data gets even more useful when planners look at it together with the 3PL team.
Data by itself won’t fix a bad forecast. The review rhythm is what makes it work.
A practical setup usually includes:
When a big promotion is coming or a new product is about to launch, the 3PL team can prepare ahead of time instead of scrambling after volume hits the dock. That kind of coordination cuts down on capacity misses, rush freight, and fulfillment delays.
The next piece is bringing all of those signals into one view.
The main difference comes down to speed. Siloed data trails behind the business. Integrated 3PL data moves with it.
With siloed data, planners often rely on weekly or monthly batch exports. By the time someone uses that file, part of it may already be out of date. With integrated 3PL data, planners can see current inventory, order velocity, and shipping status across every facility and channel. That gives them a better shot at adjusting fast, setting smarter safety stock levels, and planning for peaks based on what’s happening now.
Once the forecast is set, demand planning turns that forecast into replenishment rules tied to service targets, capacity, lead times, and returns.
With real-time 3PL data in hand, the next move is simple: use it to build a replenishment plan that matches what’s actually happening on the ground.
Share a 13-week or 90-day rolling forecast with your 3PL in weekly buckets, and update it every month. A practical setup is to treat weeks 1–4 as firm, weeks 5–8 as planned, and weeks 9–13 as tentative. That gives the 3PL enough time to line up labor, carrier commitments, and storage space before demand spikes hit.
That forecast only matters if it feeds the rules that drive inventory decisions, especially safety stock and reorder points.
Safety stock shouldn’t be one flat number across every SKU. That’s where teams get into trouble. Instead, group SKUs by sales velocity and demand variability, then assign service-level targets based on that mix. Fast-moving SKUs usually need higher service levels, while slower items can work with lower targets. From there, those targets turn into different safety stock values using formulas that account for both demand variability and lead-time variability.
This is where 3PL data earns its keep. A 3PL can provide the item-level inputs needed to make those calculations more precise, including:
Those inputs make safety stock less of a guess and more of a working rule.
Reorder points follow the same basic idea. ROP only works when lead time reflects reality: average demand during lead time plus safety stock. In plain English, that means using actual averages from PO history and carrier performance, not the lead times listed in a quote or supplier promise. These settings should live in your ERP or WMS, and they should be reviewed every quarter - or sooner if demand patterns or supplier performance start to shift in a noticeable way.
Transportation mode has a direct effect on replenishment speed and on how much inventory buffer you need to hold. LTL tends to bring more transit variability. FTL is more predictable, but it usually means larger order quantities and earlier booking windows. That tradeoff matters.
A 3PL can test replenishment setups against forecast error and service goals to help you find the right mix between freight spend and inventory risk. For example, a company might use a monthly FTL base load and then add mid-cycle LTL top-offs when demand runs ahead of plan. That kind of model gives planners a more grounded way to balance cost and service.
Returns also need a place in the plan. They’re often left out or underestimated, which can skew replenishment decisions. In U.S. eCommerce and omnichannel operations, returned items may go back into sellable inventory. If a 3PL tracks return rates, return reasons, and processing times, planners can estimate how many units are likely to become available again within the planning window.
When returns data sits in the same planning horizon as outbound demand, the picture of net replenishment needs gets a lot closer to reality. Those return inputs should flow into the same systems that control day-to-day inventory decisions, not sit off to the side in a separate report.
Forecasting works only when the data behind it is clean, current, and consistent. If the numbers coming from your warehouse, transportation network, and ERP don't line up, planning gets shaky fast. So the next step is simple: connect those systems fast enough to make decisions while the data still matters.
Planning gets better when ERP, WMS, and TMS all feed the same shared data set. When they use the same master data, planners can see orders, on-hand inventory, and in-transit status in one place instead of piecing it together from separate screens.
One step often gets missed: standardize SKU IDs, units of measure, and location codes across all three systems before you connect them. If the master data doesn't match, the output won't either. A case pack in one system and an each in another can throw off the whole picture. Use real-time event updates for picks, receipts, and adjustments, and support that with daily snapshots so the data doesn't drift over time.
Forecast accuracy should be tracked at the SKU, location, and channel level. And don't stop at error alone. Watch forecast bias too. If a forecast keeps landing high or keeps landing low, that's a system issue accuracy rates may hide.
A small set of operating metrics helps keep planning tied to what's happening on the ground:
Aging inventory helps spot slow-moving SKUs before they turn into write-offs. Low-stock alerts should fire 7, 14, or 30 days before projected inventory falls below safety stock. That gives planners time to react, which matters even more for SKUs with longer inbound lead times.
This is where scenario planning starts to pay off. Using past WMS order profiles, planners can model lift factors tied to promotions. For example, they can test what happens if order volume jumps to 2x during a peak event, then check the inventory and labor impact at each distribution center before the promotion starts.
With that kind of visibility, a 3PL can turn forecast data into day-to-day inventory calls.
This approach works best when a 3PL sends clean, on-time operating data into the planning process. Riverhorse Logistics handles warehousing, inventory management, LTL/FTL transportation, ERP/WMS/TMS integration, and returns management through one provider.
That matters because it sharpens the inputs behind the forecast. When receipts, picks, in-transit status, and returns come from one source, planners can work with current replenishment data instead of piecing things together across systems. Companies using 3PLs report better demand forecasting accuracy, and inventory accuracy gains of 20–30% are common after 3PL integration. Put simply, forecast updates stop being spreadsheet guesswork and start reflecting what is happening on the ground.
Transportation data also helps tighten up two parts of forecasting that often drift off course: lead time and replenishment timing. Riverhorse's LTL/FTL and freight brokerage data gives planners a better base for setting lead times and capacity plans, rather than leaning on fixed assumptions that may no longer match current shipping conditions.
Returns data is another input many teams don't use well enough. Riverhorse's reverse logistics and returns management services make it easier to feed return data into net demand calculations. If a high share of a certain SKU is coming back in sellable condition, that return-to-stock inventory should pull the reorder point down. It shouldn't sit in the background while a new replenishment order is already on the way.
Once those data streams are connected, planning can respond to what is actually happening in the warehouse and across transportation lanes.
Riverhorse Logistics adds the operating data layer that many businesses can't build in-house. The gains are concrete: better inventory accuracy, more realistic lead-time inputs, and cleaner net-demand signals tied to actual warehouse and transportation capacity instead of assumptions.
For manufacturers, retailers, and eCommerce brands, that means fewer stockouts and less excess inventory. It comes from connecting the right operating data to the right planning process. That's what 3PL-supported forecasting looks like when it's done well.
The best 3PL data starts with a mix of real-time internal logistics data and a few key external signals. Internal records from ERP and warehouse management systems, like historical sales, inventory levels, and transaction records, give you the baseline.
From there, accuracy gets better when businesses add weather patterns, economic indicators, consumer trends, and social media sentiment. Put together, these inputs help teams predict demand shifts, fine-tune safety stock, and react to market changes with less guesswork.
Inventory forecasting works best when you treat it as a living process, not a one-and-done project.
A simple review cycle can help keep forecasts on track:
That rhythm gives you a practical way to catch problems early instead of letting small errors snowball over time.
Returns have a direct impact on reorder points because they put items back into inventory. If you want your forecasts to stay on track, your system needs to factor in expected return volume alongside sales and lead times.
Riverhorse Logistics helps with this by adjusting reorder points based on your return processing capacity and expected demand. The goal is simple: avoid excess stock while keeping supply steady.


.png)


