Logistics
Peak season problems usually start before peak season. If you wait too long to line up trucks, LTL space, parcel limits, and warehouse flow, you often end up paying more, missing delivery dates, and relying on the spot market when rates spike.
Here’s the short version: I’d plan peak freight 3 to 6 months early, build lane-level forecasts, lock in most capacity before demand jumps, and keep backup options ready. That matters even more in a tighter 2026 market, where truckload spot rates are around $3.34 per mile, tender rejections have moved above 14%, and peak parcel fees can jump hard during holiday windows.
If I were boiling this article down, I’d focus on four things:
A few numbers tell the story fast:
This article explains how 3PLs turn those numbers into a working peak plan, from forecasting and carrier commitments to overflow rules and day-to-day execution.
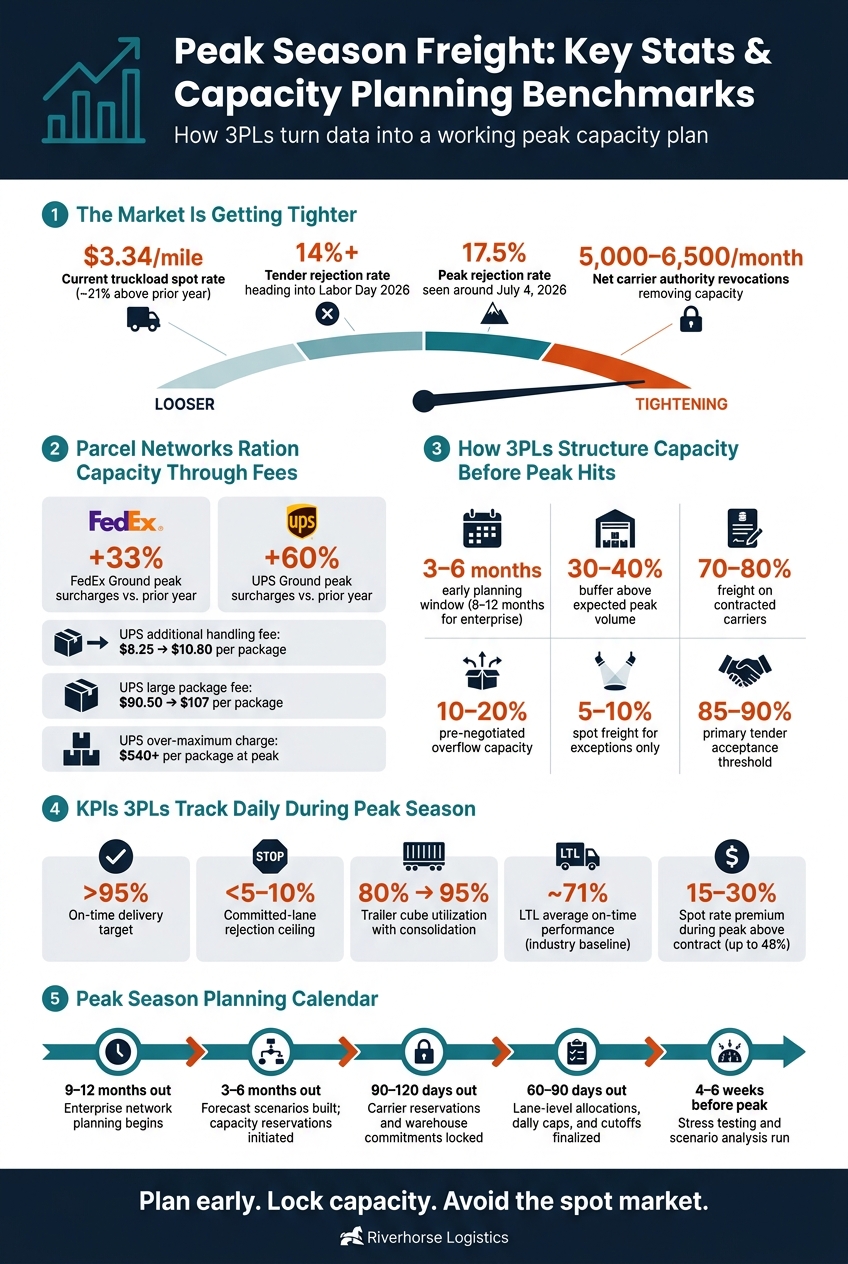
Peak Season Freight: Key Stats & Capacity Planning Benchmarks for 3PLs
Peak-season pressure tends to show up in three places: rejection rates, shipping rates, and on-time delivery. You can see it most clearly in truckload rejections, LTL delays, and parcel surcharge windows. For 3PLs, those are the signals that matter when they line up carrier capacity ahead of peak.
In truckload, the clearest sign of tightening capacity is the outbound tender rejection rate. A balanced market usually lands in the 5% to 7% range. Once rejections move into the 10% to 15% band, carriers are often choosing spot freight instead of contract loads. By mid-2026, national rejections jumped above 17.5% around the July 4 holiday, then eased to about 13.5% heading into Labor Day. That level never showed up at any point in 2024, including the prior year’s peak.
LTL pressure looks different. There isn’t the same kind of spot-market signal. Instead, strain shows up through terminal congestion, longer transit times, and higher accessorial fees. Research from MIT and C.H. Robinson found that LTL carriers average only about 71% on-time performance, with many shipments arriving up to three days late even outside peak season. When volume climbs, carriers tighten pickup cutoffs, pause some time-definite services, and add demand surcharges that push costs higher.
Parcel carriers handle peak in a more structured way, mainly through set surcharge windows and fee increases. For the peak season, FedEx Ground peak surcharges increased by about 33%, while UPS Ground surcharges rose around 60% versus the prior year. UPS peak demand surcharges for 2025 are set to run from late September through mid-January, with additional handling increasing from about $8.25 to $10.80 per package, large package fees rising from roughly $90.50 to $107, and over-maximum charges topping $540 per package at the height of the season. Put simply, these fees are how parcel networks ration capacity.
The 2026 freight market is getting tighter. Truckload spot rates are running at about $3.34 per mile - roughly 21% above prior-year levels and getting close to the late-2021 high of about $3.55 per mile. That points to a market in transition. Net carrier authority revocations have been running at around 5,000 to 6,500 per month, steadily removing pandemic-era capacity from the market. At the same time, active for-hire authorities still sit more than 86,000 above pre-pandemic levels, so capacity is tighter, but not fully constrained.
Tender rejections are already moving past 14% around Labor Day, ahead of the increases seen in each of the prior three years. That’s why 3PLs lock in capacity early and build backup options before peak hits. They use this data to set forecast volumes, secure carrier commitments, and line up contingency capacity before the season starts.
As rejection rates climb before peak season, 3PLs stop relying on broad, top-line forecasts and move to lane-level commitments.
A 3PL usually starts planning 3 to 6 months before peak. For enterprise networks, that window often stretches to 9 to 12 months ahead. At that point, forecasting stops being just a planning exercise and starts working more like risk control.
The process usually begins with 12 to 24 months of order history, broken out by SKU, channel, and destination. Then the 3PL layers in growth trends, promotions, and retailer commitments to estimate weekly freight volume.
From there, the 3PL builds three planning scenarios:
Those scenarios shape both committed and backup capacity plans. Industry guidance recommends building buffers of 30% to 40% above expected peak volume to absorb forecast error and sudden demand spikes, which helps cut down spot exposure.
Once those scenarios are in place, the 3PL turns them into a clear planning calendar.
90 to 120 days before peak, the priority is locking in capacity reservations and warehouse commitments. Then, 60 to 90 days out, the work gets more detailed: lane-level allocations, daily shipment caps, and carrier cutoffs come into focus.
This is also where volume bands come into play. A volume band sets minimum, target, and maximum shipment levels for each lane. That gives carriers a clear picture of what normal and elevated demand should look like.
If freight goes beyond the committed band, the overflow plan takes over. That extra volume may be routed to a backup carrier, shifted to another mode, or held in temporary warehousing until space opens up.
One retail chain case study reported locking in carrier capacity for 95% of projected peak volume by October 1, leaving only 5% to a pre-negotiated surge carrier pool.
Once capacity is reserved, the next step is deciding which shipments should move with which carriers.
During peak, carrier selection isn't just about who has room. It's about matching freight with carriers that have the right service record for that lane and shipment type. 3PLs look at carrier scorecards, lane-level transit history, tender acceptance rates, claim patterns, and cost data to make those calls.
That means a high-priority replenishment lane may go to a carrier with a strong on-time delivery record, while lower-urgency freight gets routed through options that offer more flexibility and lower cost.
An integrated 3PL like Riverhorse Logistics adds another layer here. Riverhorse Logistics can bring together transportation, warehousing, brokerage, fulfillment, inventory, ERP, and returns data to line up forecasted demand with committed capacity. That makes it easier to define committed lanes, set shipment cutoffs, spot consolidation opportunities, and build overflow rules before peak demand hits.
Once forecast volume and carrier commitments are in place, 3PLs turn the plan into day-to-day rules. A common mix is 70% to 80% contracted volume, 10% to 20% pre-negotiated overflow, and 5% to 10% spot freight for exceptions. The logic is simple: keep most freight out of the last-minute market, where peak-season spot rates can jump as high as 48% above contract benchmarks.
Carrier tiering is a big part of how this works on the ground. For each key lane, a solid setup usually includes at least three vetted carriers:
That gives the 3PL a clear fallback path when tenders get rejected, instead of scrambling on the open market. Research shows that 85% primary tender acceptance is the most common acceptable threshold cited by both shippers and carriers, with 90% close behind.
Seasonal terms matter too. Before Q4, 3PLs work with carriers to set temporary rate schedules, guaranteed capacity bands, detention rules, and pickup windows. When overflow capacity is negotiated ahead of time, instead of left to the spot market, the 3PL can model total landed cost per order before peak starts, not while the pressure is already on.
Capacity planning doesn’t stop with carrier contracts. It also comes down to network design. One of the best ways to cut strain during peak is to reduce how far freight has to move. By pre-positioning inventory in regional or forward warehouses before the busiest weeks, 3PLs reduce the number of long-haul truckload moves needed in November and December. Pre-positioned regional inventory cuts line-haul distance and takes some of the heat off peak-season trucking demand. Shorter routes also help with congestion and hours-of-service limits, which supports on-time delivery.
Cross-docking helps keep freight moving without letting it pile up in storage. That cuts trailer dwell time and frees yard space, so carriers can turn equipment faster. Add freight consolidation to the mix - grouping smaller LTL shipments into full truckloads on shared lanes - and average trailer cube utilization can move from about 80% to 95%. Same freight, fewer line-haul trips. During peak, that matters a lot when both driver hours and trailer supply are tight.
Staged outbound scheduling ties these moves together. By setting dock appointment times, pickup windows, and carrier cutoffs weeks ahead based on forecasted throughput, 3PLs can spread activity more evenly across the day and week instead of causing avoidable bottlenecks. Drop trailer programs help even more. Carriers can leave trailers for later loading, which reduces driver wait time, lowers detention charges, and makes the shipper a better partner when capacity gets tight.
Before peak hits, 3PLs test the plan against the points most likely to break. Mature 3PLs usually run scenario analysis 4 to 6 months before peak, checking how the network holds up under conditions that could easily happen during execution. Common test cases include carrier rejections, spot rates running 20% above benchmark, promo-driven SKU spikes, and dock or warehouse bottlenecks. A 3PL might model what happens if volume comes in 20% or 50% above last year, then see whether carrier commitments and warehouse capacity can absorb it before overflow plans need to kick in.
The main KPIs during this process are on-time pickup and delivery, tender rejection rates, cost per order, dock throughput in orders or pallets per hour, and carrier cutoff adherence. Before peak, 3PLs set target bands for each one. For example, they may aim to keep priority on-time delivery above 95% and committed-lane rejection below 5% to 10%. During the season, those numbers are tracked daily or weekly in TMS and WMS dashboards, tied back to the forecasted volume bands and committed lanes set during planning.
If rejection rates climb above 15% or throughput starts to slip, the 3PL responds early. That can mean moving freight to backup carriers, tightening consolidation, or resetting dock appointments. That kind of quick adjustment is often what keeps the plan from falling apart during Black Friday and the rest of peak season.
Peak season capacity pressure isn’t random. It follows a pattern. The 2026 data shows the same story across truckload, LTL, and parcel networks, which means forecasting, carrier commitments, and inventory positioning are the main levers. That’s why planning beats reaction.
Shippers that lock in carrier commitments, set routing guides, and place inventory before peak hits spend less time scrambling in the spot market, where peak-season premiums of 15% to 30% are common. Late planners usually deal with higher rates, more tender rejections, and weaker service when demand tightens.
After capacity is secured, the next job is execution. That comes down to matching the right freight to the right network. 3PLs help bridge demand forecasts and day-to-day operations by turning lane-level volume projections into carrier agreements, aligning inventory placement with expected shipping waves, and watching operating metrics closely enough to catch issues early. The payoff is simpler planning and fewer peak-season surprises.
For U.S. shippers, working with a 3PL earlier often leads to better access to capacity, steadier on-time performance, and freight costs that are easier to plan around. Riverhorse Logistics helps shippers move peak-season planning into action through warehousing, transportation, and e-commerce fulfillment.
Start early and treat peak season capacity planning as an ongoing process, not a one-time task. A rolling 12-month planning model lets you update plans with real-time data instead of leaning only on static annual budgets.
Start with a close look at current shipping volumes and carrier relationships. From there, use predictive analytics and collaborative forecasting to adjust transportation resources and inventory levels before seasonal demand spikes and market disruptions hit.
There isn’t one fixed percentage. In peak seasons, the goal is to balance steady costs with enough flexibility to handle swings in demand.
Use a base forecast to set contractual minimums, a most-likely forecast to guide day-to-day operations, and an upside scenario for backup planning. Looking at the past 12–18 months of freight volume helps spot seasonal spikes and shows how much capacity needs longer-term protection.
Focus on KPIs in four areas: cost, operations, customer satisfaction, and technology.
Key metrics include transportation spend, on-time delivery, tender acceptance, units per hour, order accuracy, cycle times, delivery exceptions, satisfaction scores, system adoption, automation metrics, real-time inventory, and MAPE for forecasting and capacity planning.


.png)


